


Particle size analysis is a critical practice that drives countless quality control programs. Because of this, the accuracy and repeatability of your results have never been more important.
With test sieve analysis, specifically, achieving reliable results consistently is relatively easy, as the practice has been used since the late 19th century. That said, user error is still a concern, as retrieving, presenting, and archiving the results are manual processes.
To combat user error when handling your test sieve analysis results, W.S. Tyler created a data recording program that can be used in any test sieve analysis operation. This easy-to-use program is backed by our 150 years of industry experience and dedication to helping you tackle the roadblocks you may face.
With that, this article was written to highlight exactly how our data recording program works so you can get a better idea of whether or not it's right for you. It will cover:
- What the test sieve analysis data recording program is
- How the test sieve analysis data recording program works
- How you can get your hands on the test sieve analysis data recording program
What Is the W.S. Tyler Test Sieve Analysis Data Recording Program?
With any test sieve analysis process, your main objective is to get the best representation of the particles that make up the sample you are working with. This involves either recording the weight retained on each test sieve or the percentage of material that has passed through each sieve.
These findings help you build a particle size distribution curve.
The Test Sieve Analysis Data Recording Program is an Excel-based calculator that allows you to record, display, and save the results of your test sieve analysis process in a convenient environment.
For more information on the importance of an accurate particle size distribution curve, read the article below:
How Does the W.S. Tyler Test Sieve Analysis Data Recording Program Work?
When you load the Excel file, you will find a welcome, introduction, how-to, sieving standard procedure, software tutorial, analysis data, and a graph tab. Here's what to expect from each tab:
How To: Lays out how to conduct a reliable test sieve analysis
Sieving Standard Specification: Provides information on U.S. sieving standards
Software tutorial: Step-by-step guide on how to use the software
Analysis Data: This is the tab where you will plug in your data
Graph: Automated graph that displays the particle distribution and cumulative weight results of your analysis
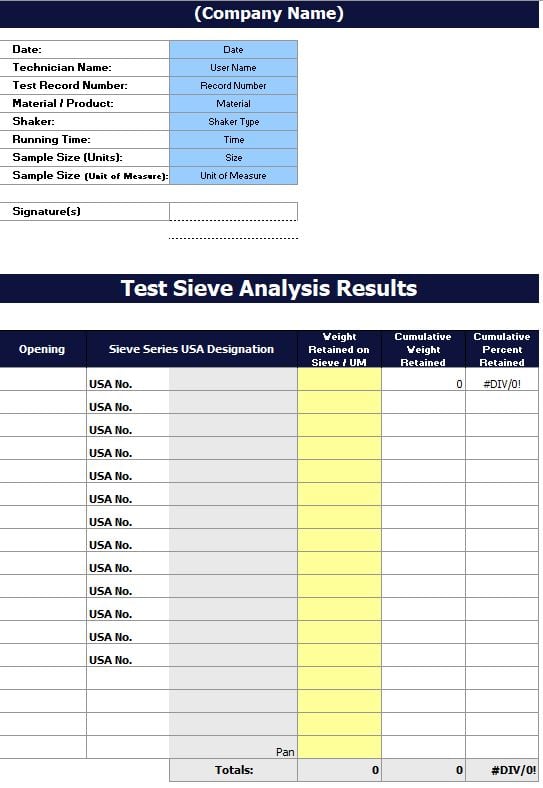
Turning to the analysis data tab, you will first want to plug in the date of the analysis, technician name, test record number, the material being worked with, the shaker type, test run time, sample size, and the unit of measurement used to measure the sample weight.
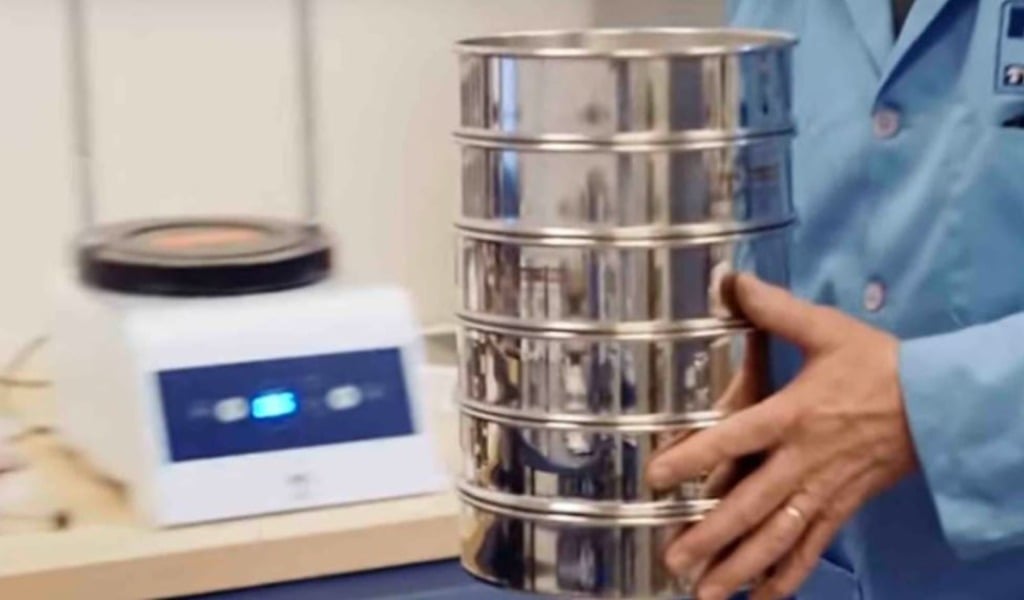
After entering the details about your test and successfully running your material, you should begin entering data into the test sieve analysis results section.
Entering the test sieve designations of your stack in the gray boxes will trigger the software to automatically populate the opening size of each sieve. Once these parameters are logged, you will want to enter the weight retained on each sieve, prompting the program to tabulate the cumulative weight and percentage retained.
The bottom cells of the weight retained, cumulative weight retained, and cumulative percent retained columns will reflect the totals of their respective categories.
Moving to the graph tab will give you a visual representation of your findings. This includes an accurate particle distribution curve as well as a linear distributive graph outlining the cumulative weight retained across your sieve stack.
How Do I Buy the W.S. Tyler Test Sieve Analysis Data Recording Program?
Purchasing W.S. Tyler's test sieve analysis data recording program is similar to any other product. You can request a quote through our quoting system, reach out through our Contact Us page, reach out via email at info@wstyler.com, or call 1-800-321-6188.
You can request a copy of the program file for $36.02. You do not need to provide any information about your process or shipping information.
All that is needed is an email address, as we will send the program file directly to your email once your order has been processed.
That said, this program is an excellent addition for those wanting to ensure they are making the most out of each test. This is especially true if you are starting a lab from scratch or refreshing an existing one and are placing an order for new equipment.

Resolve Data Inconsistencies To Maintain the Integrity of Your Quality Control Program
W.S. Tyler's test sieve analysis data recording program was designed to make the recording, presenting, and saving of test sieve analysis results seamless. Those who use it will gain insight into the larger, the average, and the smaller particles in their sample needed to generate the best representation of their production line.
Sometimes, after running material, you will find that your results are inconsistent. Data inconsistencies can be caused by a number of things, and troubleshooting the issue(s) is critical to the success of your operation.
W.S. Tyler has been a prominent entity in the particle size analysis industry for over 150 years and strives to leverage the expertise within our four walls to help you perfect your process.
Find out everything you need to know about sieve analysis inconsistencies in the article below: